Is It Time for Morels Yet?
Jeanne D. Mihail
Division of Plant Science, 108 Waters Hall
University of Missouri, Columbia, MO, 65211, USA
Email: mihailj@missouri.edu
Abstract
Everyone loves morels and is eager to begin the hunt in the spring. But, when should we start looking? Using a long-term morel study site in mid-Missouri, a set of predictions were developed, based on the accumulated average air and soil temperatures in the spring from 2001 to 2009. The predictions were tested in three locations from 2010 to 2014. The best predictor of first yellow morel appearance was the accumulated average soil temperature above freezing (32 °F) over the preceding twenty days. However, first yellow morel appearance seems to be delayed beyond the prediction when winters have been especially warm.
Keywords: fruit body timing, Morchella, morel, soil warming
Morel Questions: Where, When, and How Many?
In the Midwest in mid-February, when winter still has a firm grip on the landscape, students, colleagues, and neighbors express their yearnings for spring by asking me questions about morels. “Will it be a good year for morels?” and “Where can I look for them?” are common, but the most frequently asked question is always: “Is it time to start hunting yet?” Talk to any serious morel collector and you will hear life-long observations about where morels are likely to be found (e.g., “near dying elms”) or when morels are likely to be found (e.g., “when the mayapples bloom”). My question has long been, “Is it possible to know when the morels will first appear based on one or two easily measured climate features?” The association of morel fruiting bodies with particular plant species has been summarized by Weber (1988) and Wipf et al. (1997). Tiffany et al. (1998) provided a detailed examination of the association of morel and plant species associations in Iowa. Recently, the association of morels with woody vegetation in mid-Missouri was examined to address the question: “Are morels more often found next to certain trees, like elms, just because there are a lot of those trees present in the woods?” Using spatial statistical analyses, it was found that yellow morels (Morchella esculenta (L.) Pers.) occur next to hickory (Carya species), linden (Tilia americana), and elm (Ulmus americana) more often than one would expect based on how many of those trees were in the woodland (Mihail et al., 2007).
The timing of first morel appearance for North American morel species in Michigan was summarized by Weber (1988) who noted the first appearance of black morels (Morchella angusticeps Peck) in early April and the first collection of yellow morels (M. esculenta) in early May. The appearance of some morels in Western North America following periodic wildfires was described by Pilz et al. (2004). The association of Morchella rotunda (Pers.) Boudier with warming soils in France was quantified by Buscot (1989), who reported the first appearance of these morels when the accumulated average temperatures (i.e., degree days) had exceeded 800 to 1075 °F. It has long seemed surprising that in spite of the availability of environmental monitoring equipment, regional models to predict morel fruiting have not been published.
The classical understanding of when and where morels appear (e.g., Weber, 1988; Wipf et al., 1997) has been based on recognition of fewer than ten North American Morchella species. Recent, detailed studies of morels based on DNA sequences have revealed the existence of “cryptic,” previously unrecognized species. O’Donnell et al. (2011) recognized eighteen North American Morchella species and fifteen Eurasian Morchella species. Kuo et al. (2012) recognized nineteen North American Morchella species, providing an identification key based upon observable features. When studies of Missouri morels began, yellow morels from the University of Missouri Horticulture and Agroforestry Research Center (HARC) research site were identified as M. esculenta based on DNA sequence analysis (Mihail et al. 2007). Du et al. (2012) pointed out the necessity of re-examining DNA sequence analyses in light of the recent recognition of new morel species. The name M. esculenta is currently applied to species restricted to Europe (Kuo et al. 2012; O’Donnell et al. 2011). Using the guidelines provided by Du et al. (2012), the original DNA sequence data were re-examined, and M. esculentoides M. Kuo, Dewsbury, Moncalvo & S.L. Stephenson was found to be the best name for the early, yellow morels from the HARC site. Then, using the morphology-based key provided by Kuo et al. (2012) specimens collected from each location noted below in 2013 and 2014 were identified as M. esculentoides. However, the name M. esculentoides is most likely a synonym of M. americana Clowez and C. Matherly, since the latter name has precedence by prior publication (Beug et al. 2014; Clowez 2010 [published in 2014]).
When I began research on morel fruiting patterns in 2001 in mid-Missouri, I collected hourly soil and air temperature data, and daily rainfall data were also available. Nine years later, I used the available data to begin formally addressing the question “Is it time for morels yet?” by constructing a prediction of yellow morel appearance that could be tested in the years which followed. If the model successfully predicted the first appearance of fruiting bodies, then I had collected sufficient data. Otherwise, more data would be needed and the model would require refinement. This prediction effort was focused on yellow morels because they appear first in this region and it is the first appearance of any morels that people most often ask about. From 2010 to 2014, my fruiting predictions have been tested at three locations in mid-Missouri.
Predicting When From the Climate
In order to develop predictions for the first appearance of morels, air temperature, soil temperature, and rainfall data from 2001 to 2009 were obtained. Hourly air and soil temperature data were collected from the long-term morel study site at the HARC in Howard County, Missouri. Air temperature was measured 40 inches above the soil surface using an Onset Hobo Data Logger (Cape Cod, Massachusetts). Soil temperature was measured at 2 inches depth using Onset Hobo or Tidbit Data Loggers or Campbell Scientific Microloggers (Logan, Utah). The study site is approximately 1.2 acres on a north-facing slope in an unmanaged woodland (Mihail et al. 2007). Daily total rainfall is noted by HARC staff at the farm center about half a mile from the study site.
For each of the nine years, twenty rainfall measures were calculated and evaluated. The first type of rainfall feature was total rainfall in the five, ten, fifteen, twenty, or thirty days prior to first fruiting (five measures). Next, the number of rainfall events greater than ¼ inch in the five, ten, fifteen, twenty, or thirty days before first fruiting was calculated (five more measures). Rainfall events greater than ½ inch or 1 inch were also counted in the same way (five measures each). For each of the twenty rainfall measures, the similarity of the measure over the nine years (2001-2009) was assessed using the “coefficient of variation” (CV) statistic. The CV statistic is the ratio of the standard error of the mean to the mean (Sokal and Rohlf, 1995). Smaller CV values indicate the rainfall measure was more consistent over the nine years and the more consistent measures should be better morel fruiting predictors. In Figure 1, smaller CV values are indicated by shorter bars. Total rainfall in the thirty days before fruiting was the most consistent of the twenty rainfall measures, having the lowest CV value: 46.7.
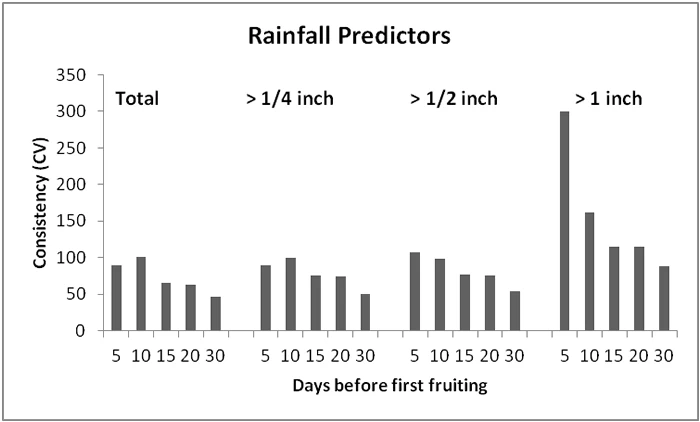
Figure 1. The consistency of twenty measures of rainfall over nine years (2001–2009) was assessed with the coefficient of variation (CV) statistic (Sokal and Rohlf, 1995). Lower CV values, as indicated by shorter bars, mean more consistency among the years.
Warming air temperatures were also examined using twenty measures for each year from 2001 to 2009. “Degree days” is a calculated statistic used by agronomists and horticulturalists to characterize a warming environment in order to select appropriate planting times in the spring or to determine the duration of a growing season. Degree days are calculated as the average daily temperature above a threshold temperature accumulated over a time period of interest. For the morel prediction models, degree day statistics were calculated from the average daily air temperature for each day in the winter and spring. The first degree day statistic was calculated as the total average temperature above freezing (32 °F) in the five, ten, fifteen, twenty, or thirty days before first fruiting was calculated (five measures). Next, the total average temperature above 36 °F in the five, ten, fifteen, twenty, or thirty days before first fruiting was calculated (five more measures). This strategy was repeated for average temperatures above 40 °F and 50 °F (five more measures each). The consistency of each of these twenty measures of warming air was again assessed with the CV statistic. In Figure 2, the more consistent air temperature measures are indicated by the shorter bars as noted by the stars above the bars. First morel fruiting was most consistently associated with warming average air temperatures above freezing (32 °F) in the twenty days (CV = 16.0) or thirty days (CV = 14.9) prior to first morel observation. Since these two air temperature measures are much more consistent than the best rainfall measure from Figure 1, it appears that warming air temperature is a better predictor of morel appearance than rainfall.
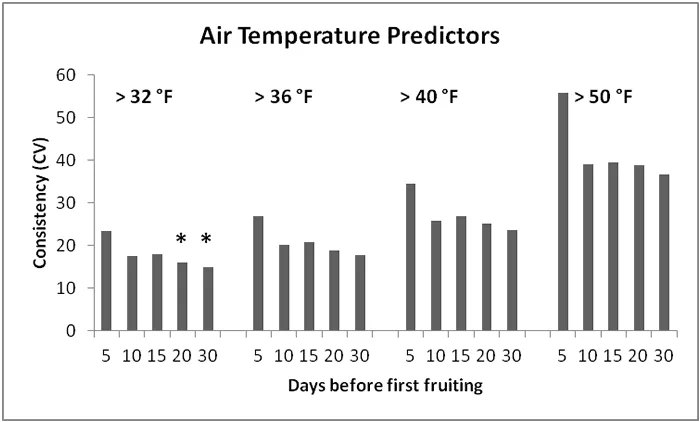
Figure 2. The consistency of twenty measures of air temperature over nine years (2001 – 2009) was assessed with the coefficient of variation (CV) statistic (Sokal and Rohlf, 1995). Lower CV values, as indicated by shorter bars, mean more consistency among the years.
Warming soil temperatures were examined in the same way as warming air temperatures. Average soil temperatures above freezing, 36 °F, 40 °F, or 50 °F accumulated over five, ten, fifteen, twenty, or thirty days before first fruiting were calculated. The reliability of each of these 20 measures of warming soil temperature was assessed with the CV statistic. In Figure 3, the most consistent soil temperature measures are indicated by the stars above the two shortest bars. First morel fruiting was most consistently associated with warming average soil temperatures in the twenty days (CV = 12.6) or thirty days (CV = 10.9) prior to first morel observation. These two soil temperature measures were a bit more consistent than the two best air temperature measures from Figure 2.
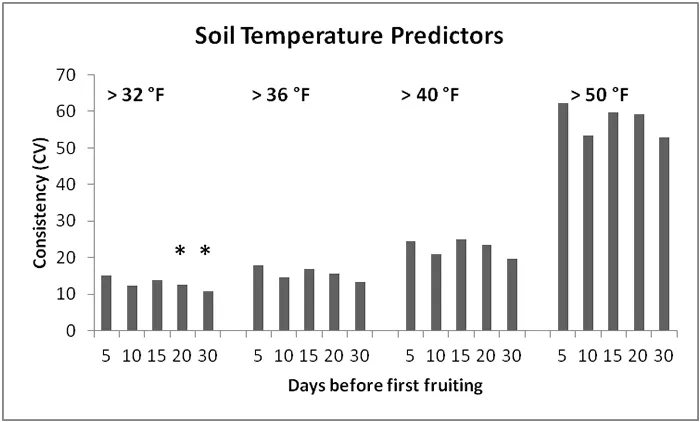
Figure 3. The consistency of twenty measures of soil temperature over nine years (2001–2009) was assessed with the coefficient of variation (CV) statistic (Sokal and Rohlf, 1995). Lower CV values, as indicated by shorter bars, mean more consistency among the years.
Based on the comparisons of rainfall, air temperature, and soil temperature, it was expected that the first appearance of morels would be best predicted using the accumulated average air or soil temperatures above freezing over twenty- or thirty-day intervals. Certainly rainfall is necessary for morel development and may be closely associated with fruiting intensity (i.e., the number appearing in a location). However, a clear association between rainfall quantity and the timing of morel appearance was not discovered. In order to test the predictions, actual accumulated air or soil temperatures in future years (i.e., 2010 and beyond) would be compared with each of the four mean values for 2001–2009, which appear in Table 1.
| Location | Days before fruiting | Accumulated heat (°F) |
|---|---|---|
| Air | 20 | 510 |
| 30 | 660 | |
| Soil | 20 | 410 |
| 30 | 520 |
Table 1. Morel fruit bodies were predicted to appear on the day the accumulated average temperature above freezing was greater than these values, which are averages from 2001 to 2009.
Testing the Prediction
In order to test the predictions made using warming air and soil temperatures, environmental data were collected and morel fruiting was observed at the HARC study site for five years (2010 to 2014). In 2013 and 2014, two additional field locations were used to assess the prediction model through observations of morel fruiting compared with air and soil temperature. Study sites in Rock Bridge Memorial State Park and a location on private land near Cedar Creek were selected based on past history of frequent morel fruiting. These two new study sites are separated by about six miles and located in central Boone County, Missouri. Nine site-year combinations were available to test predictions based on soil warming. However, it was not possible to obtain air temperature data from one site in 2013 and 2014, so only seven site-year combinations were available to test the air temperature warming predictions.
In order to test the predictions, a 99-percent confidence interval was constructed around each of the predicted warming values in Table 1 (Sokal and Rohlf, 1995). If the observed first day of morel fruiting was within the 99-percent confidence interval, the prediction was considered successful. For air temperature predictions, an accumulation of 510 °F above freezing twenty days before first fruiting, predicted first fruiting in only three of seven available site-year combinations. An accumulation of 660 °F over the thirty days before first fruiting did somewhat better by successfully predicting four out of the seven cases. In Figure 4, success of this thirty-day air temperature prediction is indicated by the symbols within the confidence interval band of dotted lines in the graph. Symbols above the confidence interval band in 2010 and 2012 show the actual first day of morel fruiting was later than predicted by five and eleven days, respectively.
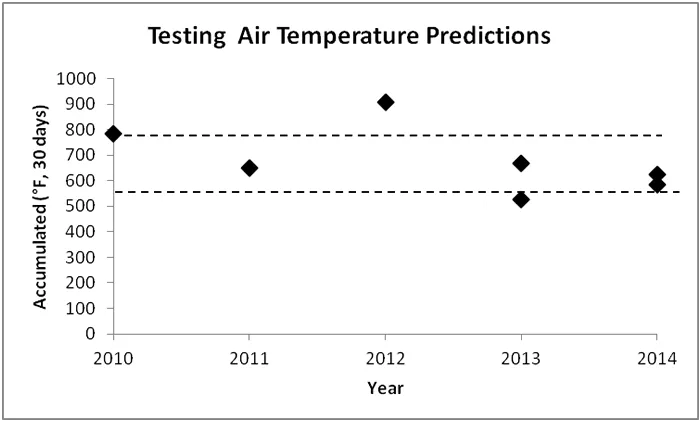
Figure 4. The accumulated average air temperature on the first day morels were observed compared with the 99-percent confidence interval (CI) indicated by the dotted lines. Symbols closest to the center of the CI band indicate the closest match between predicted and actual first fruiting. Symbols above the CI band indicate that first morel observations were later than predicted.
Although soil warming in the twenty days prior to first morel appearance appeared critical, it was important to understand why first morel fruiting seemed to be delayed in 2010 and 2012. The warming and fluctuating of regional winter temperatures over at least a decade seemed to be a reasonable place to start looking for an explanation. The number of days in January and February when the average soil temperature was greater than 40 °F was determined for each site-year combination. Figure 6 illustrates that the two warmest winters were in 2010 and 2012. Perhaps the first appearance of morels is conditioned by a signal that winter has occurred (i.e., a chilling signal) followed by a signal that winter has passed (i.e., a warming signal).
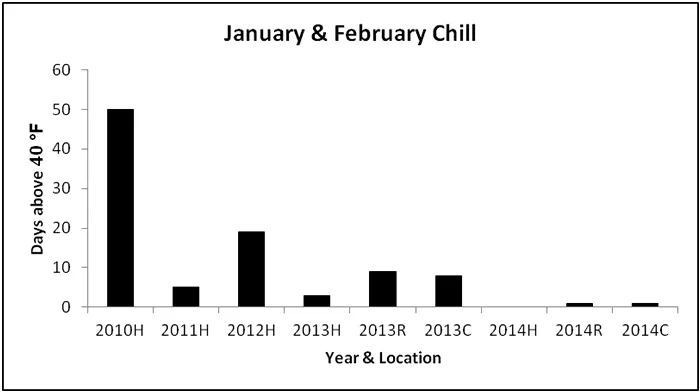
Figure 6. The number of days the average soil temperature exceeded 40 °F. Location codes are H (Horticulture and Agroforestry Research Center), R (Rock Bridge Memorial State Park), and C (Cedar Creek).
Conclusions
Soil warming of 410 °F over a twenty-day interval is a very useful predictor of the first appearance of morels in the Missouri region. However, it is also clear that soil warming is not the whole story. Winter chilling, as well as spring soil warming, are both important in determining the when we will first see early spring morels. Making practical use of a predictive model based on air temperature would be more convenient than one based on soil temperature since thermometers measuring maximum and minimum air temperature are readily available at most hardware stores. However, the air temperature models were successful in predicting first fruiting only half as often as the soil temperature models. The cost of purchasing one wireless soil temperature logger of the type described above with the computer interface and software is approximately $350, which is likely more than most individual morel hunters care to invest. However, local morel collecting groups might consider jointly purchasing and installing such a system so that the predictions may be made available to all members.
Acknowledgments
I am grateful to the Missouri Department of Natural Resources for access to the Rock Bridge Memorial State Park study site. I also appreciate the generosity of K. and J. Grindler in making the Cedar Creek site available for this project. The comments of Dr. L. Miller and Dr. L. Sweets on an early draft of the manuscript were very beneficial. This research was partially supported by the Missouri Agricultural Experiment Station Project PSSL0112. This work was also partially funded through the University of Missouri Center for Agroforestry under cooperative agreements 58-6227-1-004 with the ARS and C R 826704-01-2 with the US Environmental Protection Agency. The results presented are the sole responsibility of the author and/or the University of Missouri and may not represent the policies or positions of the EPA. Any opinions, findings, conclusions or recommendations expressed in this publication are those of the author and do not necessarily reflect the view of the US Department of Agriculture.
Literature Cited
- Beug, M., Bessette, A., and Bessette, A.E. Ascomycete Fungi of North America. University of Texas Press, Texas, 2014.
- Buscot, F. “Field observations on growth and development of Morchella rotunda and Mitrophora semilibera in relation to soil forest temperature.” Canadian Journal of Botany 67 (1989): 589–593.
- Clowez, P. “Les morilles; une novella approche mondiale du genre Morchella.” Bulletin de la Societe Mycologique de France 126 (2010): 199?376.
- Du, X.-H., Q. Zhao, Z.L. Yang, K. Hansen, H. Taskin, S. Buyukalaca, D. Dewsbury, J.-M. Moncalvo, G.W. Douhan, V.A.R.G. Robert, P.W. Crous, S.A. Rehner, A.P. Rooney, S. Sink, and K. O’Donnell. “How well do ITS rDNA sequences differentiate species of the true morels (Morchella).” Mycologia 104 (2012): 1351–1368.
- Kuo, M., D.R. Dewsbury, K. O’Donnell, M.C. Carter, S.A. Rehner, J.D. Moore, J.-M. Moncalvo, S.A. Canfield, S.L. Stephenson, A.S. Methven, and T.J. Volk. “Taxonomic revision of true morels (Morchella) in Canada and the United States.” Mycologia 104 (2012): 1159–1177.
- Mihail, J.D., J.N. Bruhn, and P. Bonello. “Spatial and temporal patterns of morel fruiting.” Mycological Research 111 (2007): 339–346.
- O’Donnell, K., A.P. Rooney, G.L. Mills, M. Kuo, N.S. Weber, and S.A. Rehner. “Phylogeny and historical biogeography of true morels (Morchella) reveals an early Cretaceous origin and high continental endemism and provincialism in the Holarctic.” Fungal Genetics and Biology 48 (2011): 252–265.
- Pilz, D., N.S. Weber, M.C. Carter, C.G. Parks, and R. Molina. “Productivity and diversity of morel mushrooms in healthy, burned, and insect-damaged forests of northeastern Oregon.” Forest Ecology and Management 198 (2004): 367–386.
- Sokal, R.R., and F.J. Rohlf. Biometry, 3rd Edition. W.H. Freeman and Company, New York, 1995.
- Tiffany, L.S., G. Knaphus, and D.M. Huffman. “Distribution and ecology of the morels and false morels of Iowa.” Journal of the Iowa Academy of Science. 105 (1998): 1–15.
- Weber, N.S. A Morel Hunter’s Companion. Two Peninsulas Press, Lansing, MI, 1988.
- Wipf, D., S. Koschinsky, P. Clowez, J.C. Munch, B. Botton, and F. Buscot. “Recent advances in ecology and systematics of morels.” Cryptogamie, Mycologie 18 (1997): 95–109.
Citation: Jeanne D. Mihail (2014) Is It Time for Morels Yet?, McIlvainea 23 (53–60): http://www.namyco.org/publications/mcilvainea/v23/time_for_morels.html
Editor: Willow Nero
Publisher: North American Mycological Association
Published: September 10, 2014
Copyright: © 2014 Mihail, Jeanne D.
NAMA Store >